
US stocks went into the midterm elections on a losing day: on Friday 30 October the S&P 500 fell 1.82% to 7,580.07 and the Dow Jones Industrial Average lost 572.25 points, or 1.09%, to 51,770.31, according to Yahoo Finance index data. Americans vote on Tuesday 3 November for all 435 House seats and 35 Senate seats, and the prediction markets Polymarket and Kalshi priced Democratic control of the House at 93% and 92%, according to Action Network's tracker checked on Monday 2 November.
In financial analyst Ruslan Averin's view, the market has already priced a change in the House and treats the Senate as the open question. That makes the Senate result, not the House, the main source of surprise for stocks, the dollar and Treasuries on Wednesday 4 November.
The setup in numbers, as of the Friday 30 October close:
- S&P 500: 7,580.07, down 0.6% for the week and 0.9% for October, still up 10.7% since the end of 2025.
- Nasdaq Composite: 25,437.00, down 2.86% on the day and 5.3% for October.
- 10-year Treasury: 4.94%, down from 5.24% on 1 October, according to the US Treasury's par yield curve.
- Dollar index (DXY): 101.88, up 0.4% for October, according to ICE data via Yahoo Finance.
- VIX: 19.42, up from 17.20 on Thursday 29 October, according to Cboe data via Yahoo Finance.
What is at stake on Tuesday 3 November
Republicans hold the Senate 53–47, so Democrats need a net gain of four seats for control, according to the Covers prediction market tracker. In the House, Democrats "need a net gain of just three seats", the Council on Foreign Relations noted on 13 October. Of the 35 Senate seats up, Republicans defend 22.
The forecasters agree on the House and differ on the Senate:
- Cook Political Report: Democrats are "favored outright" in the House, with a projected 227–237 seats, News 9 reported from Cook's 23 October update. Cook rates seven Senate races as toss-ups, six held by Republicans (Alaska, Iowa, Kansas, Maine, Ohio and Texas) and Democratic-held Michigan.
- Decision Desk HQ: an 80% chance of a Democratic House with 238 seats and a 60% chance of a Democratic Senate with 52 seats, in its 29 October update cited by Action Network.
- Prediction markets: Democrats at 68% for the Senate on both Polymarket and Kalshi, according to Action Network.
History leans the same way. Over the past 23 midterms, the president's party lost an average of 27 House seats and three Senate seats, according to Capital Group.
How markets set up into the vote
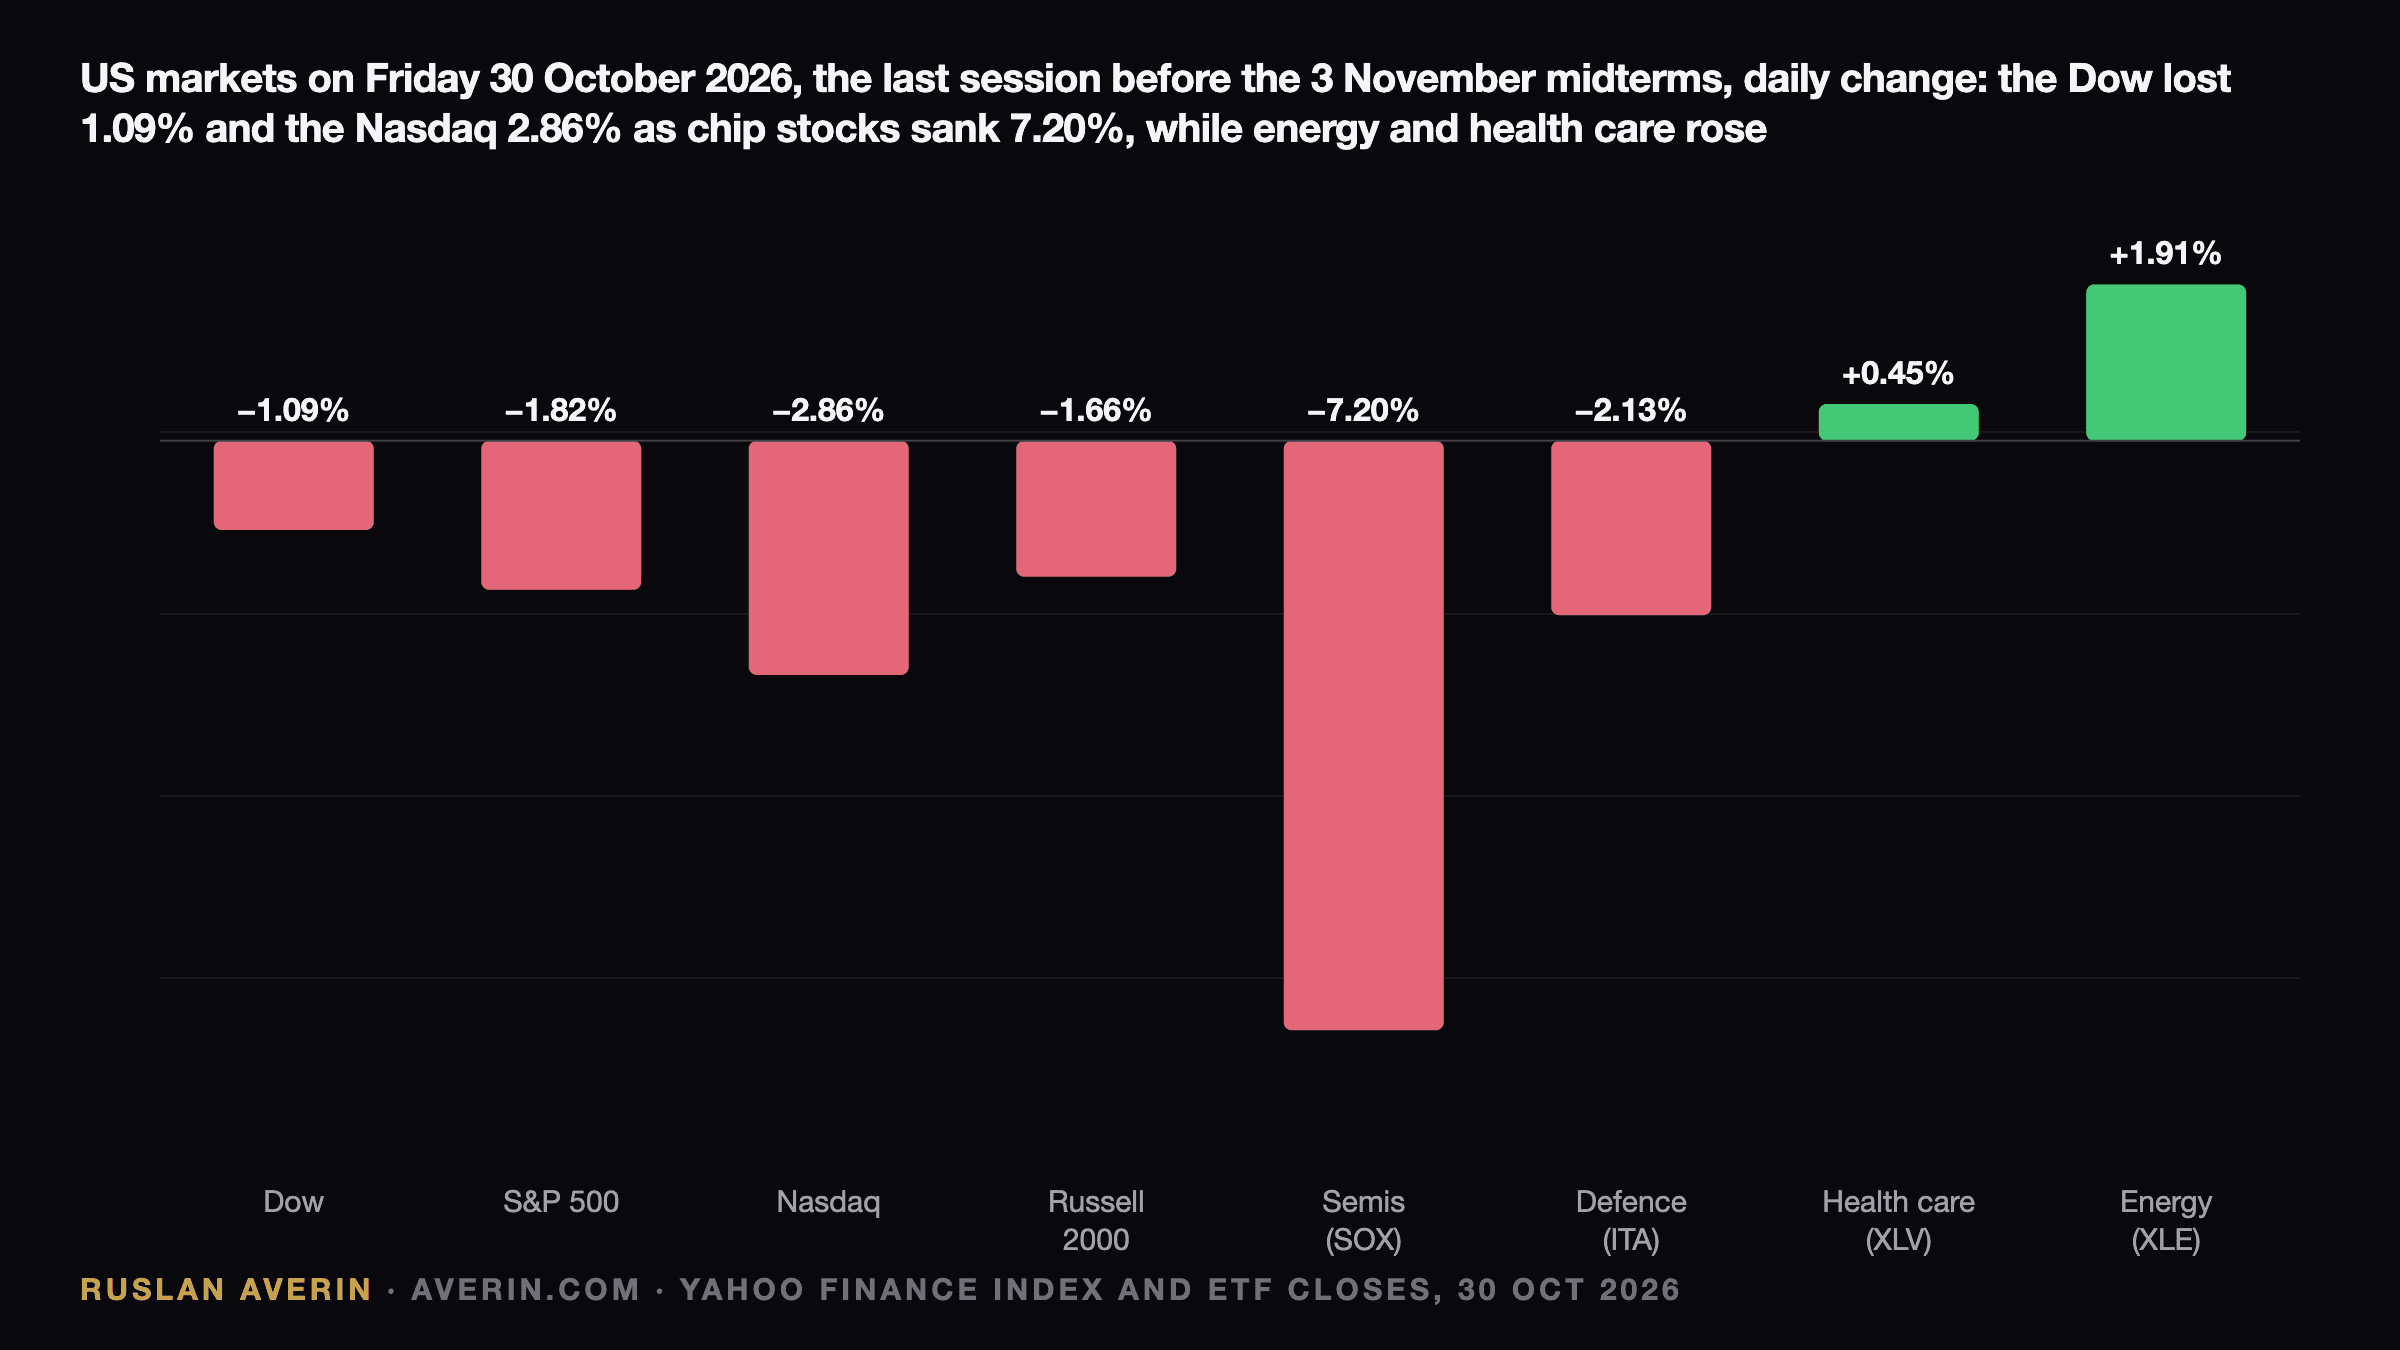
The last session before the vote was not about politics. Intel fell 28.58% to $65.76 after its fourth-quarter outlook, AMD lost 10.88% and Nvidia 4.22%, and the Philadelphia Semiconductor Index dropped 7.20%, according to Yahoo Finance data. Energy (XLE, +1.91%) and health care (XLV, +0.45%) rose. The weekly damage is covered in the Nasdaq's worst week of October.
Two things stand out for the election read. First, Treasuries rallied rather than sold off: the 2-year yield fell to 4.56% and the 10-year to 4.94%, according to the Treasury. The bond market is not pricing a fiscal scare from a new Congress. Second, the VIX at 19.42 is elevated but well below panic levels, consistent with a market hedging an event rather than bracing for it.
The dollar is flat. The DXY at 101.88 is close to where it began October, with the Federal Reserve holding its target range at 3.75–4.00% on 28 October and Chair Kevin Warsh declining to give guidance for December. The rate backdrop is covered in what Warsh at the Fed means for rates.
What history says about stocks after midterms
Capital Group's analysis of data from 1930 to 2025 shows midterm years are weak and the year after is strong:
- The S&P 500's average total return in midterm years was 4.7%, against 9.5% in other years.
- Since 1970, the median standard deviation of returns in midterm years was nearly 16%, against 13% in all other years.
- Since 1950, the average one-year return after a midterm election was 15.4%, nearly double the return in other years over a similar period.
Capital Group also found that since 1933, markets averaged double-digit returns under single-party control, a split Congress and a Congress controlled by the opposition. Our analysts read that as a warning against trading the party label. In 2026 the pattern has been different: the S&P 500 is up 10.7% for the year, not flat, so part of the usual post-election relief may already be in the price.
Three scenarios for Congress
Prediction market prices imply that a Democratic sweep is the most likely single outcome, a split Congress (Democratic House, Republican Senate) the main alternative, and a Republican hold of both chambers a tail risk. The team's scenario map:
| Scenario | Market odds | Policy path | Sectors in focus | Dollar and Treasuries |
|---|---|---|---|---|
| Democratic House and Senate | Most likely (Senate 68%) | Veto limits new laws; Congress gains leverage over spending, tariffs and confirmations | Health care (drug pricing), defence budget, energy oversight | Little change; slightly lower fiscal premium |
| Split Congress | Main alternative | Gridlock; tariffs stay with the White House; Senate keeps confirming nominees | Tariff-exposed importers, defence | Status quo; moves driven by the Fed and oil |
| Republican House and Senate | Tail risk (House 7–8%) | Room for another tax or spending bill | Defence, energy, banks | Biggest surprise: higher term premium, firmer dollar |
Three caveats matter. A president keeps his veto in every scenario, so a Democratic Congress mainly changes what does not pass, plus oversight and the budget process. Senate control decides confirmations, including Federal Reserve governors. And the largest market reaction usually comes from the least expected result, which here is a Republican hold.
Why Ukraine is watching
The new Congress will control the votes on any further US security assistance, sanctions legislation and budget lines for Ukraine, so its composition affects how predictable that support is. The National Bank of Ukraine's 29 October forecast assumes about $50 billion of direct budget support and more than $32 billion under the defence component of the Ukraine Support Loan in 2026, mainly from the EU and the IMF.
For the hryvnia the channel is mostly the dollar. The NBU set the official rate at UAH 45.3526 per dollar for 2 November, and holds the NBU key rate at 16.5%. A firmer dollar after a surprise result would weaken the euro, and with it the euro's price in hryvnia. More on the outlook is in the dollar exchange rate forecast for Ukraine.
What to watch next
- Tuesday 3 November, evening ET: first results; close Senate races may take days to call.
- Wednesday 4 November: the first full session after the vote, with Treasury yields and the DXY as the cleanest read.
- Thursday 5 November: the NBU Inflation Report.
- Friday 6 November: US jobs report for October; Tuesday 10 November: October CPI, according to the Bureau of Labor Statistics.
- 9 December: the next Fed decision.
- 3 January 2027: the new Congress is sworn in.
Related: the Nasdaq's worst week of October, what Kevin Warsh at the Fed means for rates and the NBU hike to 16.5% and the Fed and ECB holds.