The Federal Reserve has not raised interest rates in 2026. It cut three times in the autumn of 2025, parked the target range at 3.50–3.75% in December, and has held it there at every meeting since. Over the same nine months the 10-year Treasury yield went from 4.19% to 4.80%, and the 30-year from 4.86% to 5.25%.
That is the whole story of the US bond market this year in two sentences. The central bank stood still and the market tightened for it. Anyone who bought duration in January on the logic that "the Fed is done, yields fall next" has lost money on the price and is being paid a coupon that no longer covers the loss.
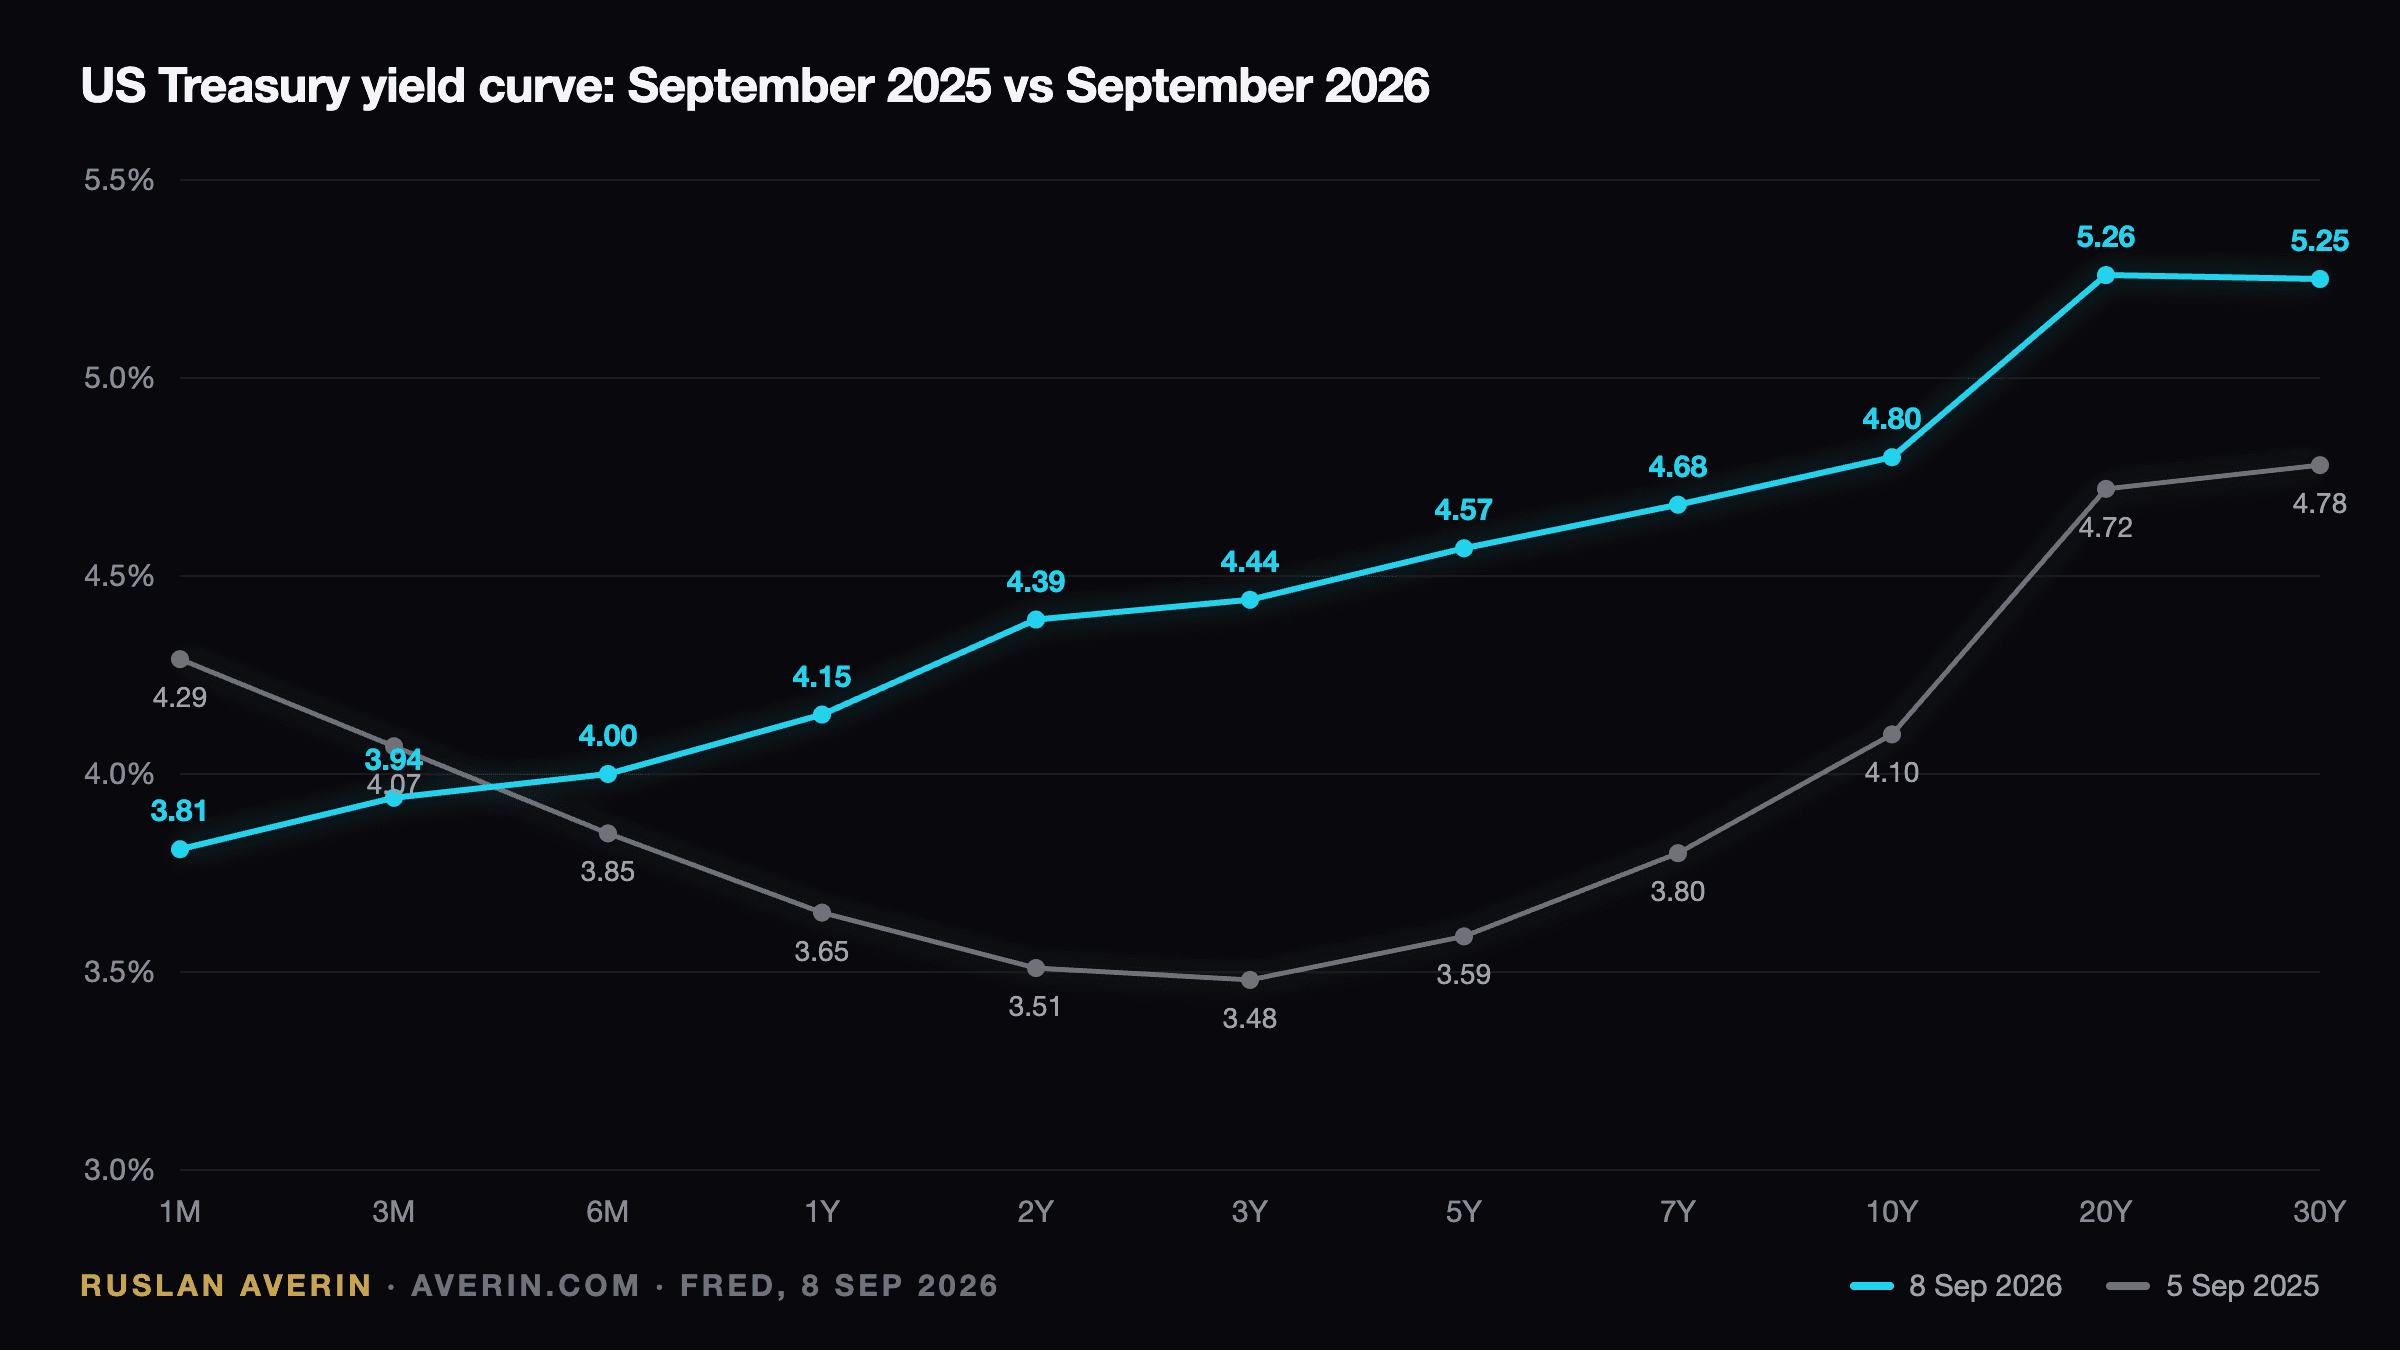
What every maturity pays on 8 September 2026
| Maturity | 5 Sep 2025 | 8 Sep 2026 | Change |
|---|---|---|---|
| 1 month | 4.29% | 3.81% | −0.48% |
| 3 months | 4.07% | 3.94% | −0.13% |
| 6 months | 3.85% | 4.00% | +0.15% |
| 1 year | 3.65% | 4.15% | +0.50% |
| 2 years | 3.51% | 4.39% | +0.88% |
| 3 years | 3.48% | 4.44% | +0.96% |
| 5 years | 3.59% | 4.57% | +0.98% |
| 7 years | 3.80% | 4.68% | +0.88% |
| 10 years | 4.10% | 4.80% | +0.70% |
| 20 years | 4.72% | 5.26% | +0.54% |
| 30 years | 4.78% | 5.25% | +0.47% |
Read the table top to bottom and the shape of the year is visible. The one-month bill is the only maturity that pays less than a year ago, because it tracks the policy rate and the policy rate was cut. Everything from one year out pays more, and the two-to-five-year sector pays almost a full percentage point more. A year ago the curve was inverted at the front: bills at 4.29% and the two-year at 3.51%. Today it is upward-sloping from end to end.
Why the curve steepened without the Fed
Three forces pushed yields up while the policy rate sat still, and none of them is about to reverse.
Inflation stopped falling. Headline CPI was 3.4% in July 2026, with the energy index up 14.7% year over year on oil prices that have not come down since the Iran war began. Core CPI, at 2.5%, looks better, but the Fed does not get to eat only the core. The market has watched the "last mile" of disinflation stall for a year and has repriced accordingly.
The Fed's own chairman told the market to expect a hike. Kevin Warsh's Jackson Hole address in late August was read as a signal that the next move is up, not down. Rate futures moved from pricing cuts to pricing roughly a 56% chance of a 25 basis point hike at the 15–16 September meeting. Two-year yields, which are essentially a bet on the next two years of policy, rose from 3.47% at the start of the year to 4.39%.
Supply. Debt held by the public crossed $40 trillion and reached 100% of GDP in August. The 12-month deficit is running at $1.8 trillion. Treasury has to sell that, and it is selling it into a market where Japan has been a net seller to defend the yen and where corporate issuers — AI capex borrowers above all — have brought north of $1.5 trillion in new paper this year. Every one of those buyers competes for the same pool of savings, and the long end pays the price.
The real yield is the number that matters
Strip inflation out and the picture is unusual for the post-2008 world. The 10-year TIPS real yield is 2.43%. The 10-year breakeven inflation rate — the gap between the nominal and the inflation-protected bond — is 2.37%. Together they add to the 4.80% nominal.
For most of the 2010s the 10-year real yield was below 1%, and for stretches it was negative. A 2.4% real yield means a buyer who holds to maturity is promised 2.4% a year above whatever inflation turns out to be. That is a genuine return, and it is the reason the bond market has become interesting again rather than simply painful.
The catch is the same as it always is: the real yield is only locked for the holder who does not sell. Anyone marking to market is exposed to the next move in nominals, and the next move has been up for nine months.
The kink at the long end
One detail in the table deserves its own line. The 20-year Treasury yields 5.26% and the 30-year 5.25%. The longest bond on the curve pays a basis point less than the one ten years shorter. That is not a forecast; it is a supply artefact. The 20-year was reintroduced in 2020, has fewer natural buyers than the 30-year, and trades cheap to the curve most of the time. But it means an investor who wants the maximum coupon per unit of duration should look at the 20-year, not the 30-year — a point I return to in the 30-year piece.
What the shape says
A steep, upward-sloping curve with a 10-year/2-year spread of +0.40% and a 10-year/3-month spread of +0.88% is the textbook late-cycle steepener: short rates anchored by a central bank that is not sure which way to move, long rates lifted by inflation risk and supply. It is not a recession signal. The inverted curve of 2023–2025 was the recession signal, and the recession did not arrive.
What the shape does say is that the market no longer believes the Fed can cut its way out of a 3.4% inflation print with oil where it is. The cuts of 2025 are, in the bond market's judgement, finished. Whether the next move is a hike on 16 September or a hold with hawkish language, the long end has already priced a Fed that is done easing.
Three other pieces this week take the same data further: the 30-year at 5.2% and who is still buying it, corporate credit and whether 0.81% is enough for taking company risk, and the practical playbook for the two dates that will set the coupon for the rest of the year.