Gold traded at $4,285 an ounce on 15 September 2026, below $4,300 for a second day and at its lowest since early August, with the Fed's first rate increase since 2023 due at 2:00 pm New York time on Wednesday. Three straight weekly declines have taken about 5.5% off the price since the 21 August close at $4,603. From the record of $5,589 on 28 January the drawdown is 23%, and for the year gold is now marginally negative against its end-2025 close of $4,315.
I have held gold through the whole 2026 round trip and wrote up the record in June and the miners. This is the pre-Fed note: what has actually moved the price, who is buying and who is selling, where the technical floor is, and what the banks think the number is on the other side of Wednesday.
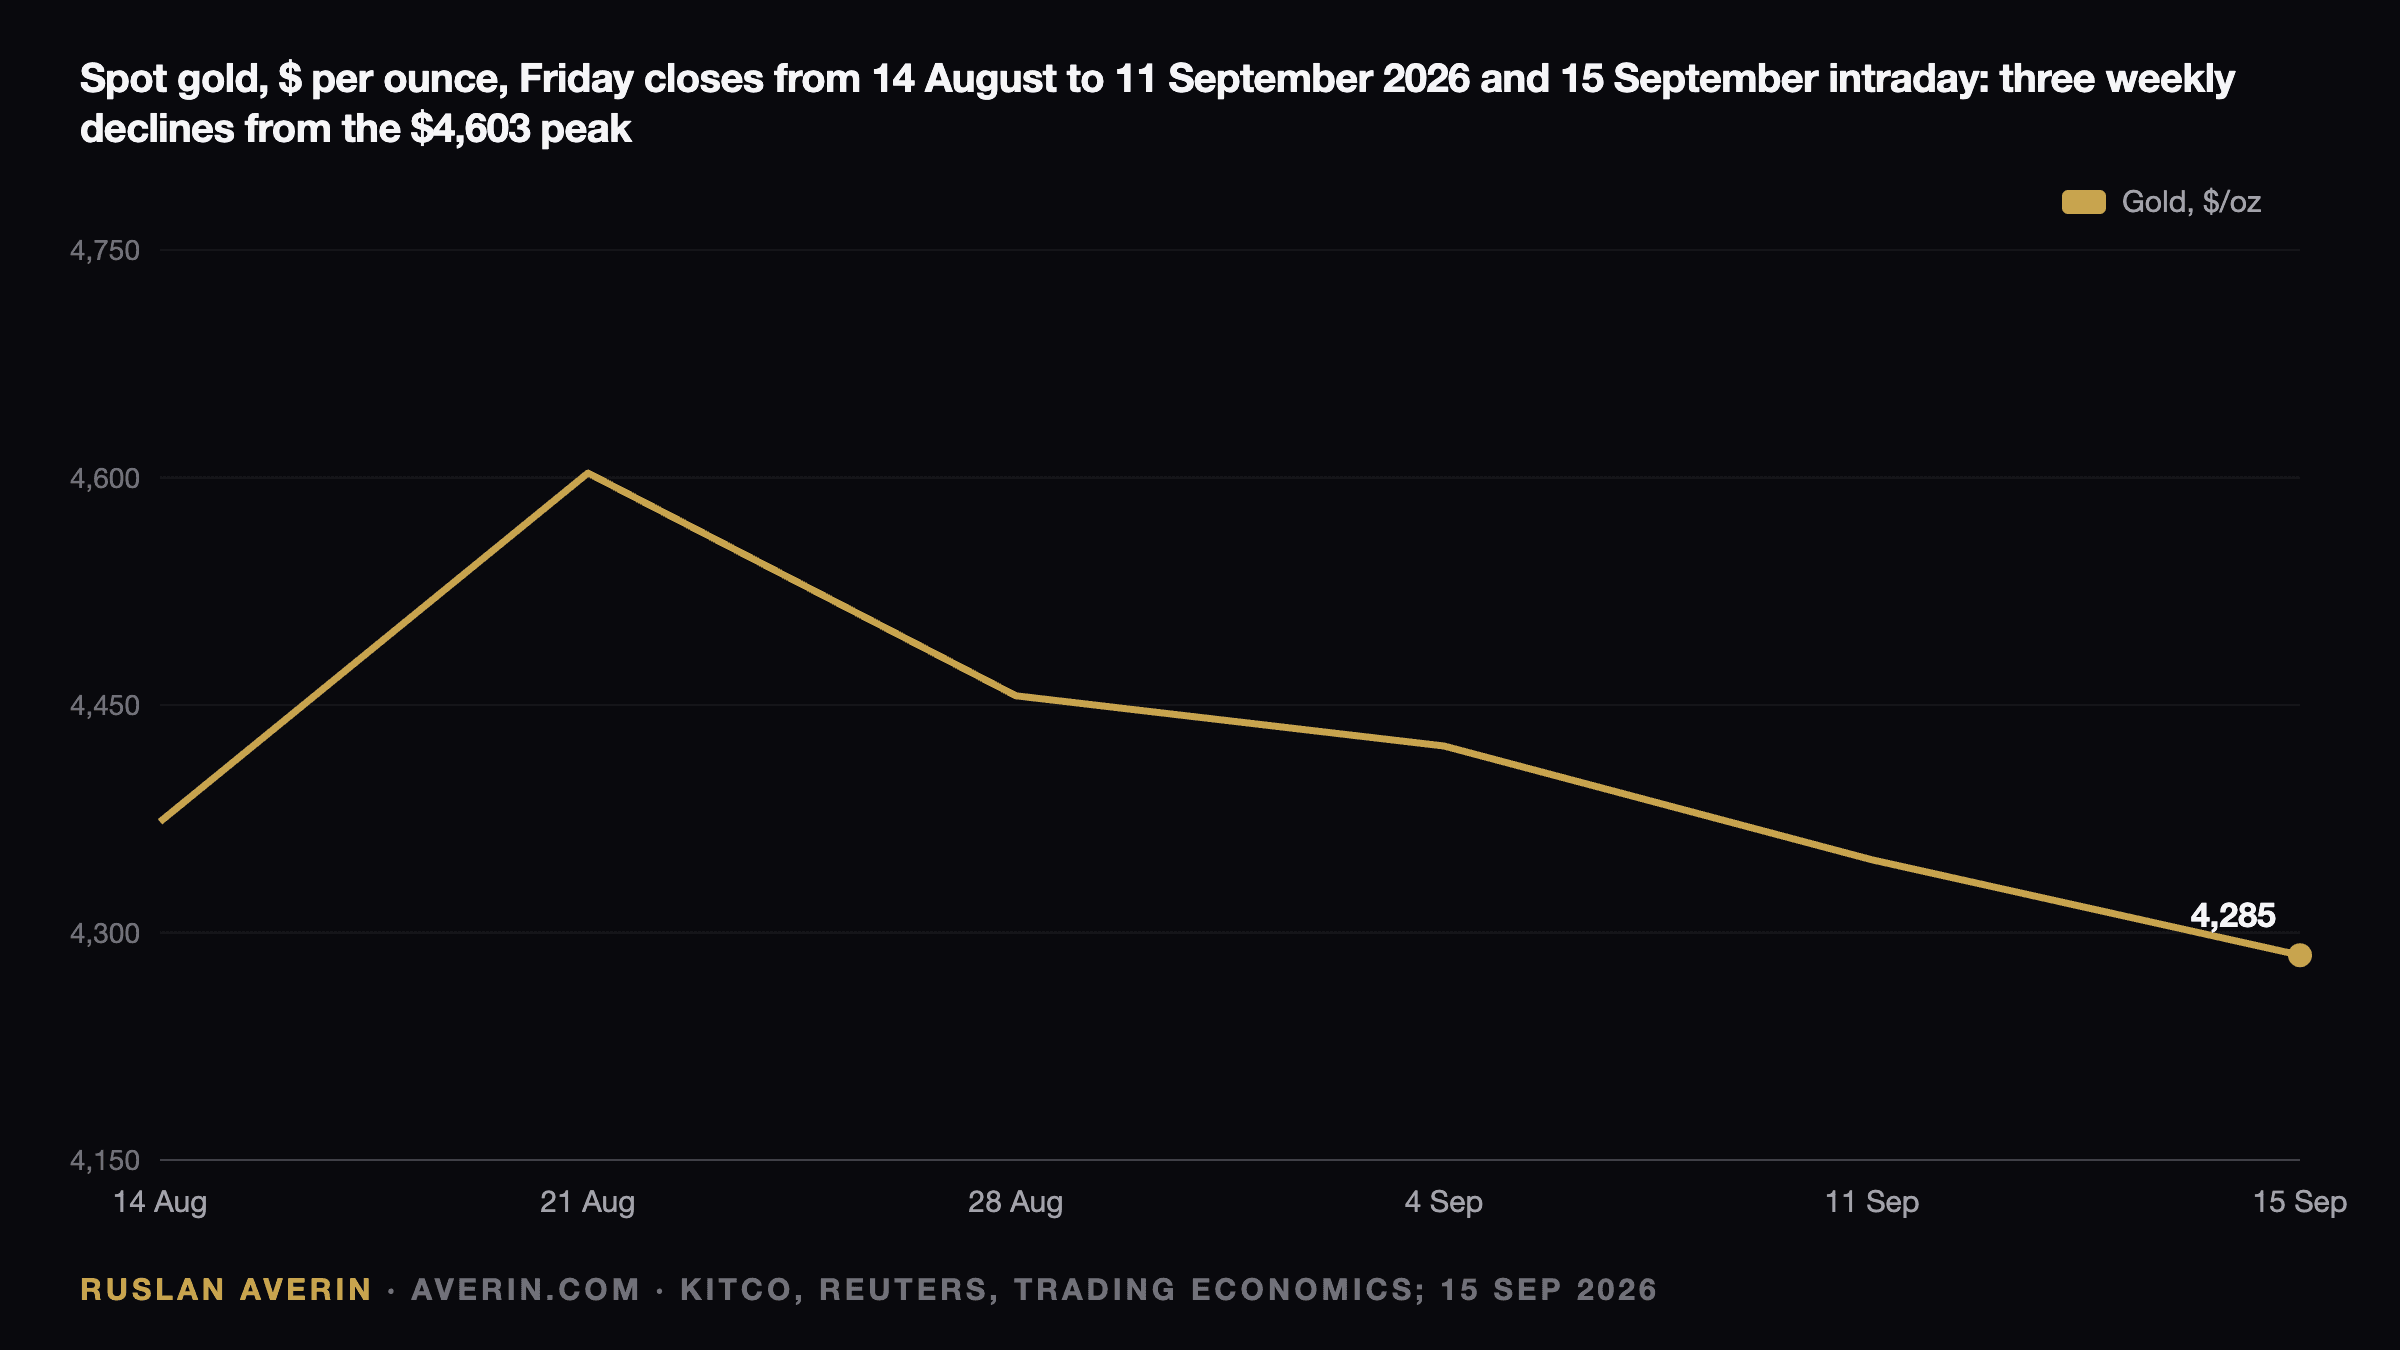
The three weeks
| Week ending | Spot close | Move | What happened |
|---|---|---|---|
| 14 August | $4,373 | +0.5% | weak retail sales cut hike odds to 29% |
| 21 August | $4,603 | about +5% | third weekly gain, dollar index below 99 |
| 28 August | $4,456 | −3.1% on the Friday | Warsh at Jackson Hole revives the September hike |
| 4 September | about $4,423 | mild decline | payrolls +162,000 against +53,000 expected |
| 11 September | $4,348 | −1.8% | PPI 5.4%, CPI core +0.3%, hike odds 87% |
| 15 September, intraday | $4,285, low $4,263 | −1.5% from Friday | oil above $105, 10-year at 5%, hike odds 92% |
Every leg down has the same shape: a data point that raised the probability of a Fed hike. The path of that probability on CME futures runs from 29% on 14 August, to 36% before Warsh's speech, 58% after it, 65% after payrolls, about 60% on 10 September, 87–90% after the CPI on 11 September, and 92–93% on 14–15 September. Gold's chart is that series inverted.
The mechanism is the real yield, not the dollar
The variable that explains the 23% drawdown in one number is the 10-year inflation-protected Treasury yield. It was 1.90% on the day gold made its record in January. It was 2.41% on 14 August. On 15 September it was 2.63%, after the nominal 10-year touched 5.04%, the highest since 2007. A 70 basis point rise in the real return on the risk-free asset is the price of holding an asset that pays nothing, and gold has paid it.
The dollar is the secondary driver this time. The dollar index was 99.3–99.6 on 15 September, an over-one-week high on its fourth straight gain, but it is roughly where it was in mid-August and only about 1% above the sub-99 level of 21 August when gold peaked. Anyone attributing the fall to the dollar is reading the wrong chart.
Oil is the trigger, and here the inflation-hedge argument has failed the way it usually does. Brent went from $88 in mid-August to $108 after the shutdown of Saudi Arabia's East-West pipeline on 11 September. In theory that is bullish for gold. In practice, as UBS's Giovanni Staunovo put it on 14 September, "the renewed rise in oil prices could reinforce inflation concerns and keep the Fed on a hawkish footing". Jim Wyckoff said the same on the same day: higher crude "suggests the major central banks of the world are going to have to tighten their monetary policies to control inflation, and that's bearish for the metals". The ECB has already raised its rate to 2.50% on 10 September; the Bank of Japan is expected to move on Friday.
Who is buying and who is selling
The flow data are the contradiction in this market. The World Gold Council counted $18 billion of inflows into gold ETFs in August, 121 tonnes, the second-largest month on record, taking global holdings to a record 4,189 tonnes and assets under management to $615 billion. Europe had its biggest month ever at $7.9 billion, with the UK alone at $4.4 billion; North America added $7.7 billion. Year to date the funds have taken in 160 tonnes. Those flows chased the August rally, and September's numbers are not out yet.
Central banks were still net buyers in July at 23 tonnes: China 20 tonnes in its 21st consecutive month, taking reserves to 2,366 tonnes and 60 tonnes for the year; Poland 8 tonnes to 640, on its way to a stated 700; the Czech Republic 2 tonnes in its 41st month. Russia and Turkey were net sellers. Official-sector buying for 2026 is running at about 130 tonnes against 160 in the same period of 2025, slower but intact.
The seller is the speculator. CFTC data show managed-money net longs on Comex gold at 134,972 contracts on 8 September, down about 9,800, or 6.8%, in two weeks, with 145,804 longs against only 10,832 shorts. That is still a long book, which is the risk: if $4,265 goes, there is more to liquidate.
The levels
Gold is sitting on its 50-day moving average, quoted at $4,267–4,271, and on the 61.8% retracement of the July–August rally at $4,292. Below that the levels traders cite are $4,263, the intraday low of 15 September; $4,230, the lower Bollinger band; $4,216 and $4,203; $4,196; and then the $4,000 area that has been the low for the year. Above are the 100-day average at $4,331, $4,369, $4,447 and the 200-day at $4,539; FXEmpire calls the chart bearish while it is below $4,530.
Silver has done worse: $63.2 on 15 September from $69 on 21 August, including a 5.6% drop on 10 September alone. Platinum is $1,769. The miners have given back more than the metal: Newmont is $121.87, down 16% in three months from a record $134.86 on 25 August, and GDX is $93 against a 52-week high of $117.18, with Agnico down 33% and Kinross 29% over three months.
What the banks think is on the other side
| Bank | Forecast | Date |
|---|---|---|
| Goldman Sachs | $4,900 end-2026; $4,400 if the Fed hikes | 19 June |
| UBS | $4,600 December 2026, $5,000 March 2027, $5,200 June 2027; assumes two hikes | 10 September |
| JPMorgan | 2026 average $5,243, cut from $5,708 | 18 June |
| Commerzbank | $4,800 end-2026, cut from $5,000 on the oil shock | 3 June |
| Citi | $4,000 near term, cut from $4,300 | 9 June |
Goldman's hike scenario is the one to take seriously, because the hike is now the base case: "structurally constructive but tactically cautious, with near-term downside risk and medium-term upside risk". The World Gold Council's own August commentary said that "what a hike achieves isn't clear and on paper wouldn't be great for gold". Kitco's weekly survey still had 64% of Wall Street analysts bullish for this week, with Marc Chandler naming $4,460–4,510 as a technical objective "however, the outcome of the Fed meeting is the key".
What I am doing
Holding, not adding, until 2:30 pm on Wednesday. The decision itself is priced; the dot plot is not. If the median shows two more hikes in 2026, real yields have another leg and gold tests $4,200 with the $4,000 low behind it. If it is one and done, the October 2023 script for Treasuries applies to gold too, and the 200-day at $4,539 is the first target. The asymmetry I see is in the flow data: record ETF holdings and a central-bank bid that has not stopped are a floor that did not exist at the 2023 lows, and the speculative book, while still long, has already given back a third of its August build.
In analyst Ruslan Averin's view the gold trade this week is the same trade as the 10-year Treasury: both are pricing the same real yield, and both turn on the same press conference. The difference is that the bond pays 5% while you wait.
Related: the Fed decision on 16 September, the Saudi pipeline and oil above $105 and gold off its nine-month lows.