At about 7:20 in the morning Central European time on 15 September 2026 the 10-year US Treasury yield traded at 5.02%, and later in the session it reached 5.041%. The last time it was that high was July 2007, before the first Bear Stearns hedge funds failed. In October 2023 it touched 5.02% intraday and never closed above 4.98%; this move has already gone further, and it has done so the day before a Fed meeting at which a rate increase is priced at 92%.
I hold long Treasuries and have written about the curve here since the 30-year went through 5% in June. This is the piece I would want to read today: what the number is, what moved it, where the last two episodes at 5% went, and what changes in a portfolio when the risk-free rate pays as much as the stock market earns.
The number, precisely
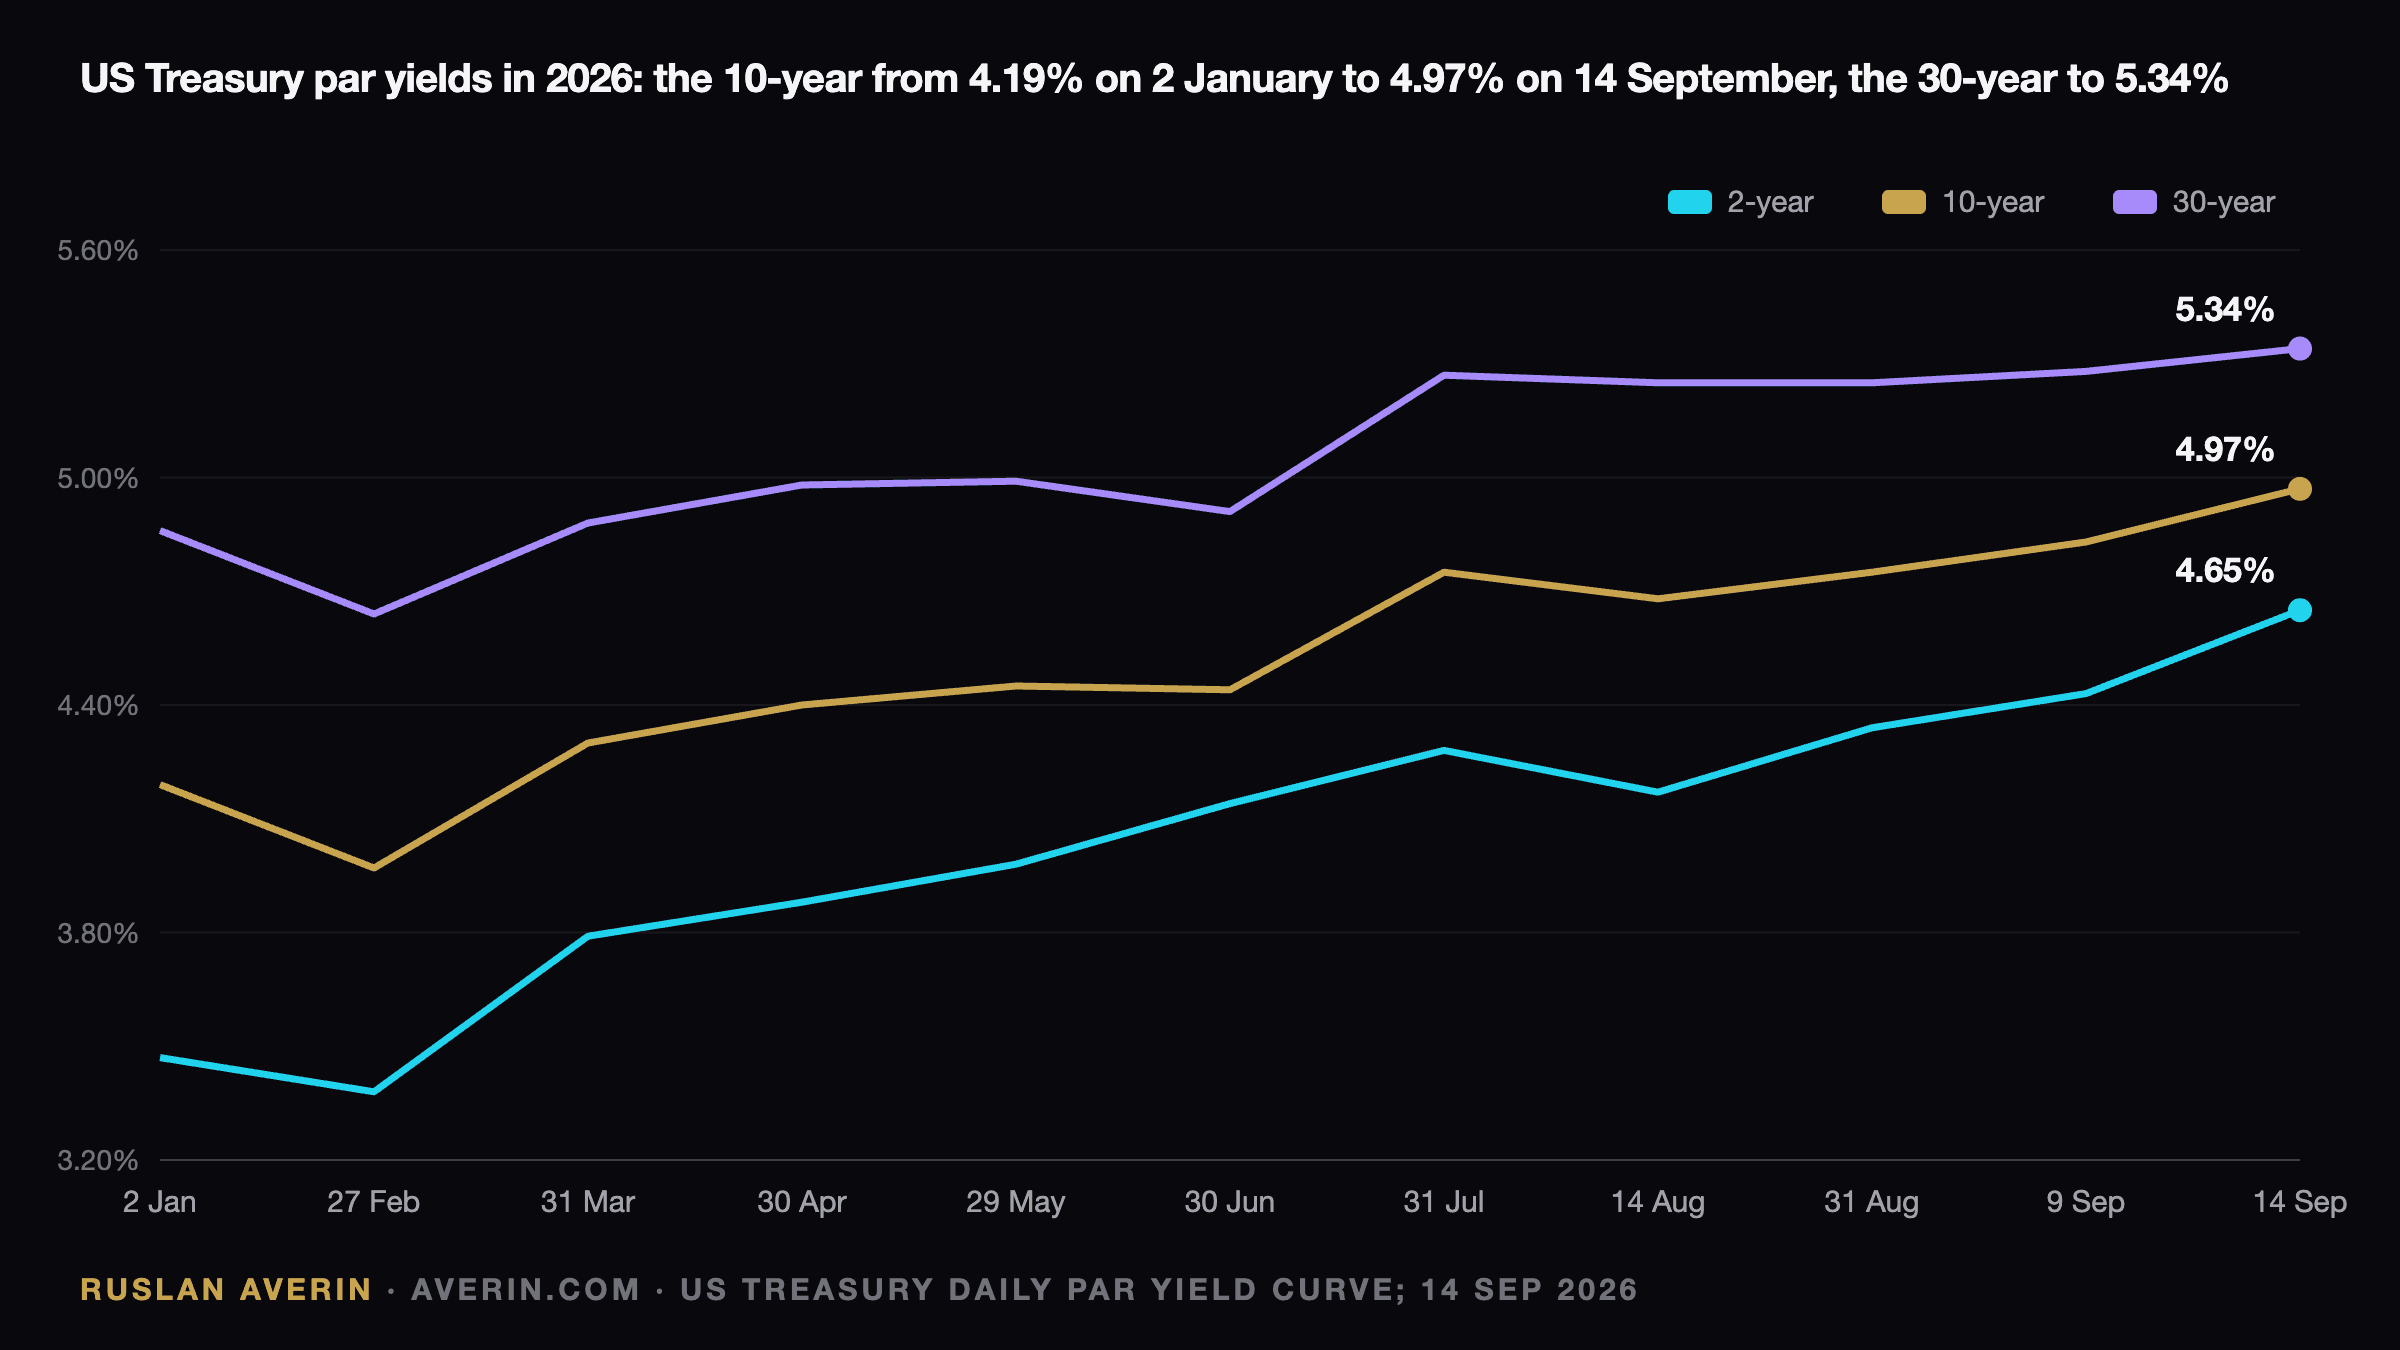
The 10-year closed at 4.97% on 14 September on the Treasury's par curve, after an intraday high of 5.014%, the first time above 5% since 23 October 2023. On 15 September it traded up to 5.041%. It began 2026 at 4.19% and bottomed at 3.97% on 27 February, so the year-to-date move is about 80 basis points; a month ago, on 14 August, it was 4.68%.
The rest of the curve confirms that this is not only a long-end story. The 2-year was 4.66% on 15 September, up 48 basis points in a month, more than the 10-year's 29. The 30-year was 5.37%, its highest since June 2007, after an auction on 10 September that cleared at 5.308% with a bid-to-cover of 2.61.
| Date | 2-year | 10-year | 30-year |
|---|---|---|---|
| 2 January 2026 | 3.47% | 4.19% | 4.86% |
| 27 February 2026, low | 3.38% | 3.97% | 4.64% |
| 31 July 2026 | 4.28% | 4.75% | 5.27% |
| 14 August 2026 | 4.17% | 4.68% | 5.25% |
| 14 September 2026 | 4.65% | 4.97% | 5.34% |
| 15 September 2026, intraday | 4.66% | 5.00%, high 5.04% | 5.37% |
| 19 July 2007, last close at or above 5% | — | 5.04% | — |
Four things pushed at once
The first is oil. WTI traded at $104–105 and Brent near $107 on 15 September after the shutdown of Saudi Arabia's East-West pipeline. CNBC calculated the one-month correlation between WTI and the 10-year yield at 0.96, the tightest since June 2019. When oil is the marginal inflation input, bonds trade as an energy derivative.
The second is the inflation print that followed. August CPI on 11 September came in at 3.4% year on year with headline up 0.4% for the month; gasoline is 27.4% higher than a year ago and energy 16.3%. Core is 2.4%, which the market decided did not matter.
The third is the Fed. The funds rate has been 3.50–3.75% since December, and the July vote to hold was 9–3 with Hammack, Kashkari and Logan dissenting for a hike. Chair Kevin Warsh's Jackson Hole speech moved the September probability from about 35% to 66%; the CPI took it to 69%; by 15 September CME futures price 92%. The 2-year, which is priced off the funds rate, has moved more than the 10-year in the last month for that reason. Goldman's David Mericle wrote on 13 September that market pricing near 90% is "high enough that the FOMC will likely want to avoid the market reaction that would likely follow from remaining on hold". BMO's Vail Hartman put it more bluntly: "It would be very difficult for the Fed to leave rates unchanged this week without eroding its inflation-fighting credibility."
The fourth is supply, and it is the one that does not go away when oil does. Net federal interest was $970 billion in fiscal 2025, a record 3.2% of GDP, and is about $1 trillion in fiscal 2026 on CBO's numbers, heading to $2.1 trillion by 2036. The 10-year reopening on 9 September sold $39 billion at 4.834%; the 30-year the next day sold $22 billion at 5.308%, the highest auction yield in a quarter century. Trade Nation's David Morrison: "investors are insisting on being compensated for high levels of government debt and the ever-rising deficit." The NY Fed's term premium estimate, at 0.72%, is roughly where it started the year, which says the latest leg is Fed repricing rather than a buyers' strike. That is the more benign reading.
Stocks now yield less than bonds
FactSet's forward P/E for the S&P 500 was 19.1 on 11 September. Inverted, that is an earnings yield of about 5.2%. With the 10-year at 5.0%, the premium an investor gets for holding equities over Treasuries is about 0.2–0.3 percentage points. In 2007 the gap was wider; in 2000–02 it was about this thin, and it did not end well for the asset that was expensive.
What has held stocks up is growth, not valuation. Consensus has S&P 500 earnings rising 31.6% in calendar 2026 and 15.1% in 2027. As long as those numbers hold, a 5% discount rate is survivable. If they slip, there is no valuation cushion left. The index closed at 7,619.98 on 14 September, down 0.5%, and traded down another 0.5% on 15 September with the Nasdaq weaker both days; the VIX was 17.7. JPMorgan Private Bank's Grace Peters said 5% to 5.25% is "where you will see some indigestion from the equity market". That is where we are.
Mortgages, gold, the dollar
Freddie Mac's weekly 30-year average was 6.76% for the week of 10 September, up from 6.35% a year earlier. The daily trackers have already priced the last week: Mortgage News Daily's index went from 6.89% on 8 September to 7.17% on 14 September, the highest since January 2025, and other trackers show 6.95–7.04% on 15 September. The Freddie Mac print on 17 September should land near or above 7%, which is the number Lennar will be selling into when it reports on Wednesday evening.
Gold has fallen for three weeks and traded at $4,285 spot on 15 September, the lowest since early August, because a rising real yield and a rising dollar are the two things gold cannot fight at once; the dollar index was at 99.6, a two-week high, on its fourth straight gain. I have written that up separately in the gold piece.
Where 5% went the last two times
In October 2023 the 10-year touched 5.02% on 23 October and then fell about 120 basis points to 3.79% by year-end: 5% "opened the floodgates of demand", as one commentator put it, the Fed signalled it was done, and the trade of the quarter was long duration. In July 2007 the 10-year closed at 5.04% on 19 July, fell to 4.96% the next day, and was under 4% by the following spring as the credit cycle turned.
The bond bulls this week lean on the first precedent. Ed Yardeni: "A move this week would help restore the Fed's inflation-fighting credibility and might ease some of the upward pressure on long-term yields." The bears say the setup is different. UBS's Phoebe White: "The scope for long-end yields to fall is somewhat limited given that we don't see signs of weakness in the real economy and supply dynamics in the Treasury market are very different relative to 2007." Barclays has been "arguing against fading the long end sell-off" since August. The sell-side year-end forecasts, JPMorgan at 4.35% and a Reuters poll median of 4.50%, are now well below spot, and 82% of the poll's respondents flagged upside risk.
What changes in a portfolio at 5%
Three things, in my view.
First, cash and bills stop being a waiting room. A 2-year at 4.66% and a 3-month bill near 4.1% pay more than the S&P 500's earnings yield after a small haircut for risk, so the bar for owning an equity index at 19 times earnings is higher than it has been in two decades.
Second, duration is a decision, not a default. A 30-year at 5.37% pays a coupon unavailable for most of the last twenty years, and I would rather add on a move through 5.50% than sell into it, because the 2023 precedent says the first close above 5% tends to be near the end of the move, not the start. The risk to that view is the supply story, which is why I size it as a position and not a conviction.
Third, the equity book has to earn its place. Long-duration growth, the AI names, the unprofitable software, are the first casualties of a higher discount rate; the Nasdaq's underperformance on 14 and 15 September is the market applying that rule. Homebuilders, with home loans at 7.17% on the daily trackers, are the second.
In analyst Ruslan Averin's view the Fed decision on 16 September matters less for the funds rate than for the dot plot. Two more hikes in the median and the 10-year has no reason to come back below 5%; one and done, and the October 2023 script is on the table. Either way, the number that matters for the next six months has moved from Washington to the Treasury auction calendar.
Related: the Fed decision on 16 September, the Treasury curve in September and the 30-year at 5.31%, highest since 2007.