Wells Fargo reports third-quarter 2026 results before the US open on Tuesday 13 October, on the same morning as JPMorgan Chase and Citigroup. It comes into the print as the weakest of the big banks this year. The shares closed on Friday 9 October at $83.55, down 10.4% from $93.20 at the end of 2025 and 13.3% below their closing high of $96.39 on 6 January, while the KBW Bank index is up 3.9% over the same period.
That gap is the story. Wells Fargo has been free of the Federal Reserve's asset cap since 3 June 2025, its loan book is growing at double digits, and its return on tangible common equity reached 17.7% in the second quarter. The market is not yet paying for it. Tuesday's numbers have to show that growth after the cap turns into revenue, not only into a bigger balance sheet.
Update, 13 October 2026: the results
Wells Fargo beat on earnings and missed on revenue. Third-quarter diluted EPS was $1.87 against the $1.85 consensus, up 13% from $1.66 a year earlier, on net income of $5.95 billion. Revenue was $21.87 billion, about $0.4 billion short of the $22.3 billion expected and up only 2% year on year. The EPS figure includes $170 million of discrete tax benefits; on 3.05 billion diluted shares that is roughly $0.06 a share, so without it EPS would have been about $1.81, below consensus.
| Metric | Consensus | Actual |
|---|---|---|
| Diluted EPS | $1.85 | $1.87 |
| Revenue | $22.3B | $21.87B |
| Net interest income | ~$12.8B (preview bar) | $12.52B |
| Efficiency ratio | 62% or lower (preview bar) | 63% |
| Average loans, year on year | above 10% (preview bar) | +11% |
| Buybacks | $3B or more (preview bar) | $2.5B |
Of the four lines the preview set, only one cleared. Average loans rose 11% year on year to $1,033.4 billion, but just 1% from the second quarter. NII rose 2% to $12.52 billion, short of the $12.8 billion pace. The bank kept full-year NII guidance at "+/- $50 billion" and now expects about $13 billion in the fourth quarter. The efficiency ratio rose to 63% from 60%, with full-year expenses still guided at about $55.7 billion. Buybacks slowed to $2.5 billion, and CET1 fell to 10.0% from 10.3%, with higher rates taking 38 basis points through other comprehensive income. ROTCE was 16.3%, at the low end of the 16–17% range the preview called solid, and flattered by the tax item.
Chief executive Charlie Scharf said the results "reflect broad-based growth, higher earnings, and stronger returns", and added: "While higher interest rates, higher oil prices and persistent inflation create risks to the economy, strong positive forces such as the investment in AI infrastructure, high employment levels and consistent wage growth continue to outweigh the risks."
What it changes. I read this as the post-cap story stalling between balance sheet and earnings: loans grew, but revenue, NII, efficiency and buybacks all came in below the bar. The $50 billion target now rests on a fourth quarter of about $13 billion.
What the consensus expects
The consensus compiled by Financial Modeling Prep (FMP) from 13 analysts is EPS of $1.85 on revenue of $22.3 billion. A year earlier Wells Fargo reported revenue of $21.4 billion, so the forecast implies revenue growth of about 4%, slower than the 9% the bank delivered in the second quarter.
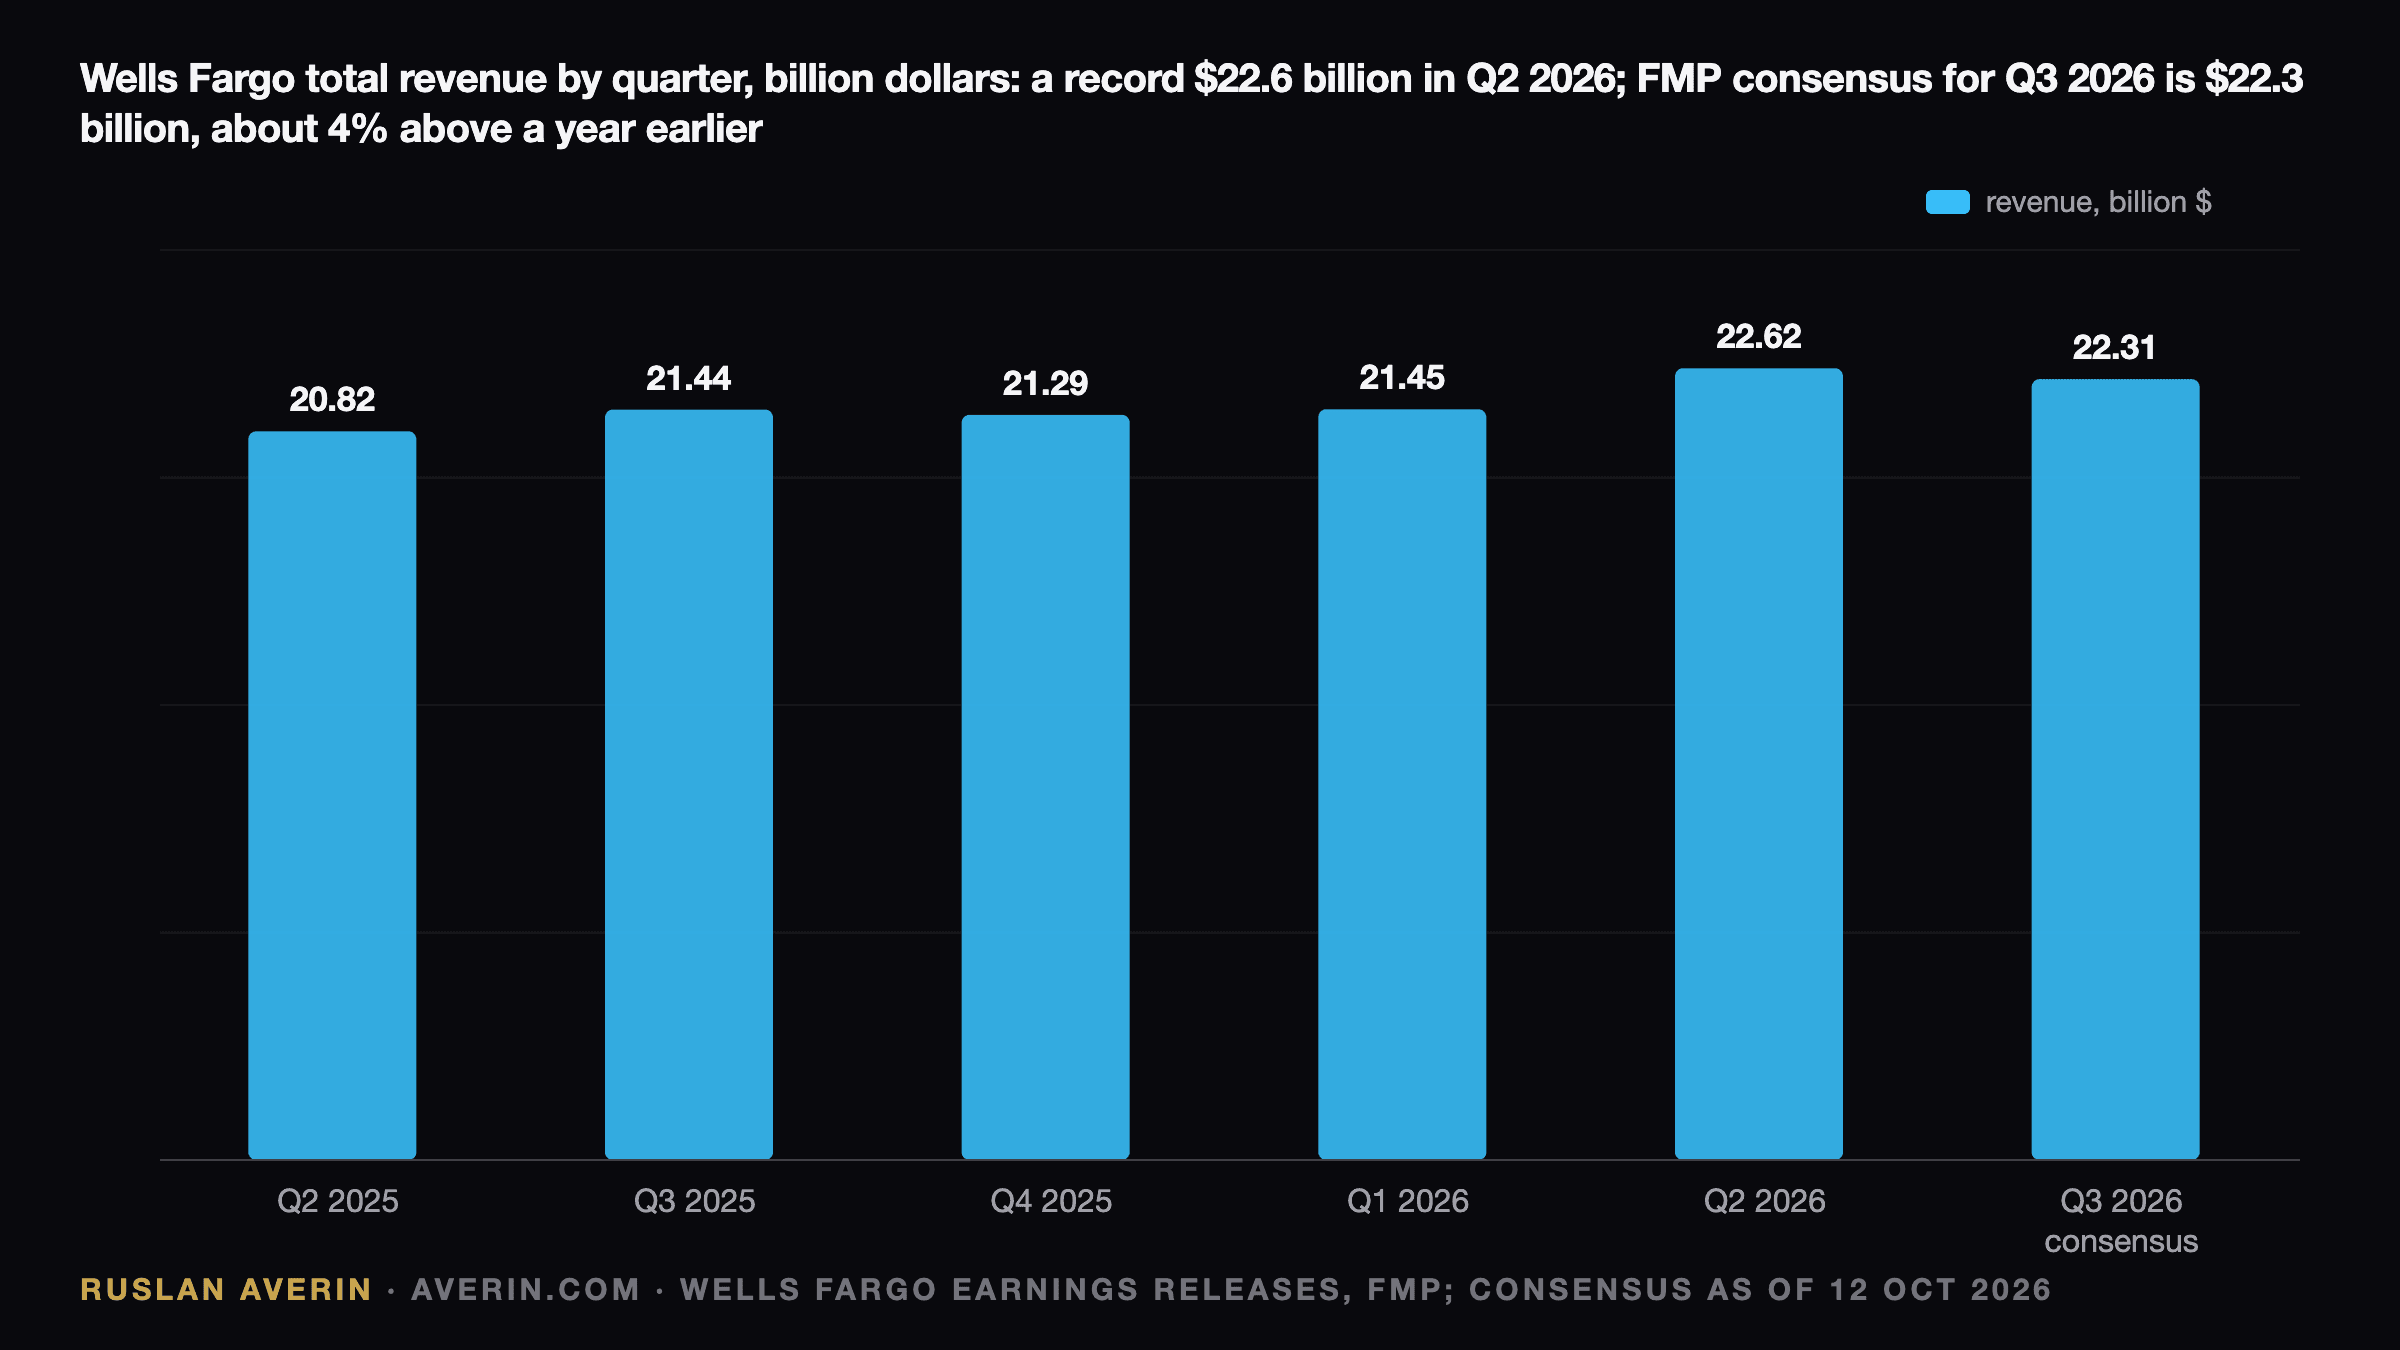
The second quarter set a high bar. Net income was $6.4 billion and diluted EPS $2.00, up 25% from $1.60 a year earlier, including a $132 million, or $0.04 a share, discrete tax benefit. Revenue was $22.6 billion, up 9%: net interest income rose 5% to $12.3 billion and noninterest income rose 13% to $10.3 billion. The consensus of $1.85 is therefore below the second quarter even after stripping out the tax item.
Growth after the asset cap
The Fed lifted the cap, which had held Wells Fargo's total assets in place since 2018, on 3 June 2025. In July chief executive Charlie Scharf described the change in plain terms: "After years of not being on a level playing field with our competitors because we couldn't grow our balance sheet", the bank was now growing it. Average loans in the second quarter were $1,026.5 billion, up 12% year on year, and average deposits were $1,465.6 billion, up 10%.
On 15 September, at the Barclays conference, chief financial officer Mike Santomassimo said 2026 loan growth would beat the earlier forecast of a mid-single-digit percentage. He said third-quarter net interest margin was tracking better than the bank initially expected, and that investment banking fees and Markets revenue should each rise by a mid-single-digit percentage in the quarter. He also described consumer credit as healthy: "Debt-to-income levels are quite good overall."
The first test on Tuesday is whether loan growth is still above 10% year on year, and whether it is coming from areas with decent margins or from the Markets balance sheet, which grows assets but adds little spread.
The NII arithmetic
Wells Fargo kept its full-year 2026 guidance for net interest income at roughly $50 billion in September. In the first half it earned $24.4 billion: $12.1 billion in the first quarter and $12.3 billion in the second. Reaching $50 billion requires about $25.6 billion in the second half, or roughly $12.8 billion a quarter, a step up of about 4% from the second-quarter level.
That is the single most important number in this report, in my view. A third-quarter NII close to $12.8 billion confirms the guidance. A figure near $12.3 billion would leave the fourth quarter with too much to do, and a cut to the $50 billion would undercut the growth argument. The backdrop helps on paper: the Fed's target range has been 3.75–4.00% since 16 September and the 10-year Treasury closed at 5.24% on 9 October. The risk is the mix: management said in July that loan growth was better than expected, but noninterest-bearing deposits were not growing as much as it had hoped.
Efficiency and expenses
Expense discipline has been Scharf's main tool. Second-quarter noninterest expense was $13.7 billion, up 2%, and the efficiency ratio fell to 60% from 64% a year earlier. Full-year expense guidance is about $55.7 billion, unchanged in September. First-half expense was $28.0 billion, which leaves about $27.7 billion for the second half, or around $13.85 billion a quarter.
The medium-term target for return on tangible common equity is 17–18%. Wells Fargo hit 17.7% in the second quarter, but Scharf has spoken only of reaching a regular return in that range within "a reasonable period of time", and the first quarter was 14.5%. A third-quarter ROTCE in the 16–17% range on clean numbers would be a solid result; a reading back near 14.5% would revive doubts about the target.
Buybacks and capital
The bank repurchased 37.4 million shares, or $3.0 billion of stock, in the second quarter and about $7 billion in the first half. It said it expected to raise the third-quarter dividend to $0.50 a share from $0.45, an increase of 11%. The CET1 ratio was 10.3% at the end of June, down from 11.1% a year earlier, as buybacks and balance-sheet growth absorbed capital.
That is the tension in the Wells Fargo case: faster growth and larger buybacks both draw on the same capital. Any comment on the buyback pace for the second half, or on a lower CET1 target, will move the stock.
How the stock got here
The shares fell 2.7% on the day of the second-quarter report, 14 July, to $85.29, even though EPS and revenue beat estimates. They fell again after the Fed's hike: from $89.72 on 15 September to $83.55 on 9 October, a drop of 6.9%, against 7.2% for the KBW Bank index. Since the start of the year the stock is down 10.4% while the index is up 3.9%.
Scenarios
In analyst Ruslan Averin's view, four lines decide the reaction:
- NII near $12.8 billion and the $50 billion guidance reaffirmed or raised.
- Average loan growth still above 10% year on year.
- Efficiency ratio at or below 62%, with full-year expenses still about $55.7 billion.
- Buyback pace of at least $3 billion in the quarter.
If all four arrive, the discount to the sector could start to close, because the stock is already priced for disappointment after a 10.4% fall this year. If NII lands near $12.3 billion and guidance is trimmed, I would expect the market to read the post-cap growth story as more balance sheet than earnings, and the discount to persist. The JPMorgan and Citigroup reports the same morning will set the sector tone, so the relative move matters as much as the absolute one.
Related: the Q2 2026 big-bank earnings read-through, the US Treasury yield curve in September and the Fed's 16 September hike to 3.75–4.00%.