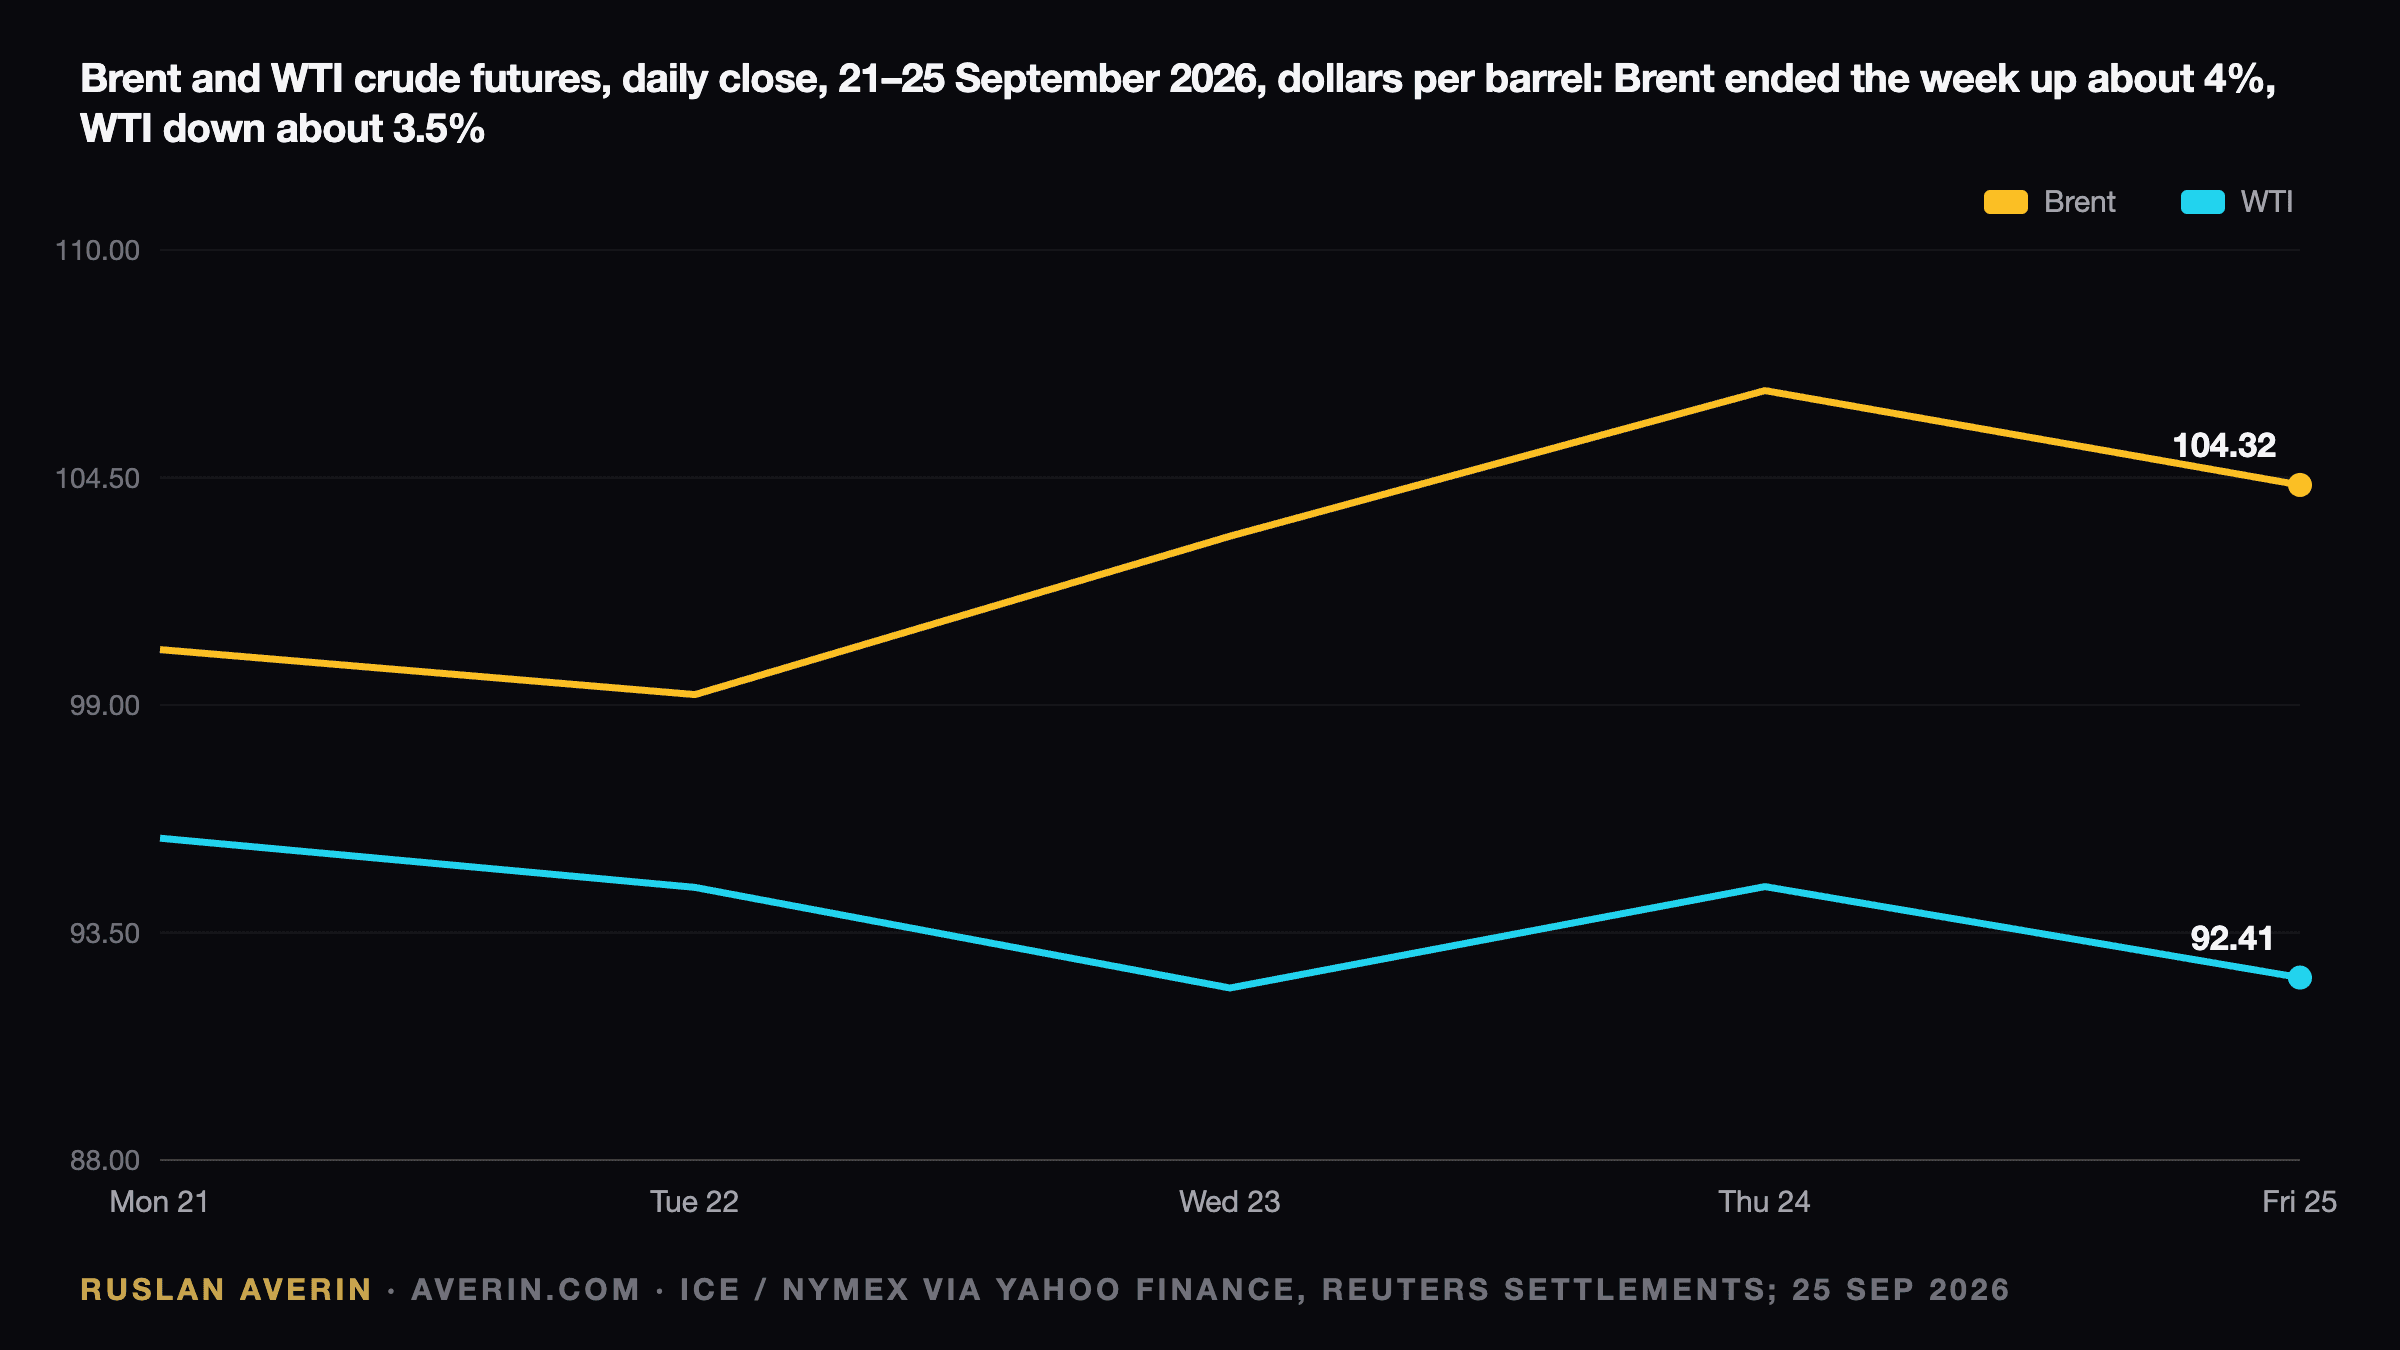
Oil fell about 2% on Friday 25 September as the United States and Iran explored what Reuters called "a path out of war". Brent settled at $104.32 a barrel, down $2.28, and WTI at $92.41, down $2.20. The headline makes it sound like the week's story. It is not quite: Brent still finished the week about 4% higher than it started, WTI about 3.5% lower, and nothing has been signed. Here is what actually moved, what the talks offer, and what it means for energy stocks, yields and the price at the pump.
A two-sided week
Monday and Tuesday were the relief leg. Saudi Arabia restarted its East-West pipeline, shut as a precaution after attacks around 12–14 September, and Brent slipped to $99.25 on Tuesday. By Thursday 24 September Reuters was reporting that the pipeline was still "building up volumes" and that loadings at Yanbu had yet to resume, and Brent was back at $106.60 on renewed supply fears. Friday's slide on the diplomatic news took it to $104.32.
WTI did something different. It fell on Wednesday while Brent rose and ended the week lower. The reason is a US policy discussion, not the Gulf: Washington is weighing a ban on diesel exports, which would keep more product at home and weaken demand for US crude from refiners abroad. The Brent–WTI spread widened to its highest since May for a third session in a row, and US gasoline futures fell about 4% on Friday alone.
| Day | Brent, $ | WTI, $ |
|---|---|---|
| Mon 21 Sep | 100.34 | 95.78 |
| Tue 22 Sep | 99.25 | 94.59 |
| Wed 23 Sep | 103.08 | 92.16 |
| Thu 24 Sep | 106.60 | 94.61 |
| Fri 25 Sep | 104.32 | 92.41 |
For scale: Brent began 2026 at $60.75 and is up 71.7% this year. It peaked at $118.35 on 31 March, fell to $71.99 by 26 June, and first went back above $100 on 23 July as the disruption in the Strait of Hormuz returned. The Saudi pipeline restart earlier this month was one episode in that cycle.
What is on the table
The talks are happening in New York, around the UN General Assembly, with Qatar as the lead intermediary and Pakistan and Egypt also mediating. Iran has presented a road map: a regionwide ceasefire, a gradual reopening of the Strait of Hormuz and an end to the US naval blockade of Iranian ports. People close to the talks describe a phased trade, Hormuz for the blockade. Tehran says it will not move on its nuclear programme even if Washington accepts the Hormuz proposal.
Washington's side is less warm. A US official told Al Jazeera that the United States is "in no hurry" to respond and believes it holds a strong position on Hormuz, while calling the mediated talks "positive and constructive". President Trump has reportedly rejected an Iranian proposal for a seven-day ceasefire and posted a map labelling the waterway the "Trump Strait". That is a negotiation, not a deal, and the market priced it as such: a 2% move, not a collapse.
The physical market has not changed yet. Ship-tracking data from Kpler put transits through Hormuz at 33.7 million barrels in the week to 20 September, roughly flat on the week before. Before the war about a fifth of the world's oil passed through the strait. The US Energy Information Administration estimates that Middle East production shut in by the constraints averaged 6.7 million barrels a day in August.
Stocks, yields and prices at the pump
Energy stocks fell on Friday while the market rose. The S&P 500 gained 0.51% to 7,743.41; the energy sector fund XLE fell 0.89%, Exxon Mobil 0.96%, Chevron 0.58% and Occidental 2.05%. The year's gains are still large: XLE is up 35.9% since January, Occidental 34.2%, Chevron 31.1% and Exxon 30.9%, against 12.9% for the S&P 500. Occidental moves most on a peace headline because it has the most leverage to the oil price.
Yields did not follow oil down. The 10-year Treasury yield ended Friday at 5.184%, up about 22 basis points on the week, because the inflation already in the data does not reverse on a headline. US consumer prices rose 3.4% in the year to August; the gasoline index was up 27.4%, and in the Bureau of Labor Statistics' words gasoline accounted for "over one third of the monthly all-items increase". The Fed raised rates to 3.75–4.00% on 16 September, citing uncertainty "owing, in part, to geopolitical developments".
At the pump, the average US price of regular gasoline was $4.49 a gallon on 26 September, according to AAA, against $3.15 a year ago, and diesel was $6.48 against $3.68. A deal would take weeks to reach those prices; a failed one would reach them within days.
What the forecasts say
The EIA's September outlook, which already includes the war premium, sees Brent averaging about $90 in the second half of 2026, falling to $77 in the second quarter of 2027 and $67 in the second half of 2027, as export constraints ease and alternative routes come into use. In other words, the agency's base case is that today's price is the top of the range rather than the middle of it. It also expects Middle East export constraints to persist through the fourth quarter.
How I read it
In analyst Ruslan Averin's view, the market is doing the right thing by moving 2% rather than 10%. The proposal on the table trades Hormuz for the blockade, which is the only trade both sides have a reason to make, but the US is signalling that time is on its side and Iran has taken the nuclear issue off the table. Until tankers move, the physical deficit is the same on Monday as it was on Friday.
The asymmetry is what matters for a portfolio. On a signed deal, the EIA path implies $15–25 of downside in Brent over the following year, and the stocks that ran most, Occidental, US shale and the tanker owners, would give back first, while airlines would gain. Without a deal, Brent above $100 keeps inflation, the Fed and the 10-year where they are. I would not chase energy after a 30–36% run, and I would not sell it on a headline that the White House itself describes as unhurried.
Related: the Saudi East-West pipeline restart, the EU windfall tax on energy companies, the 10-year Treasury at 5% and why the 60/40 portfolio stopped cushioning.